Global Semiconductor Foundry Revenue Share: Q2 2023
Published Date: September 12, 2023
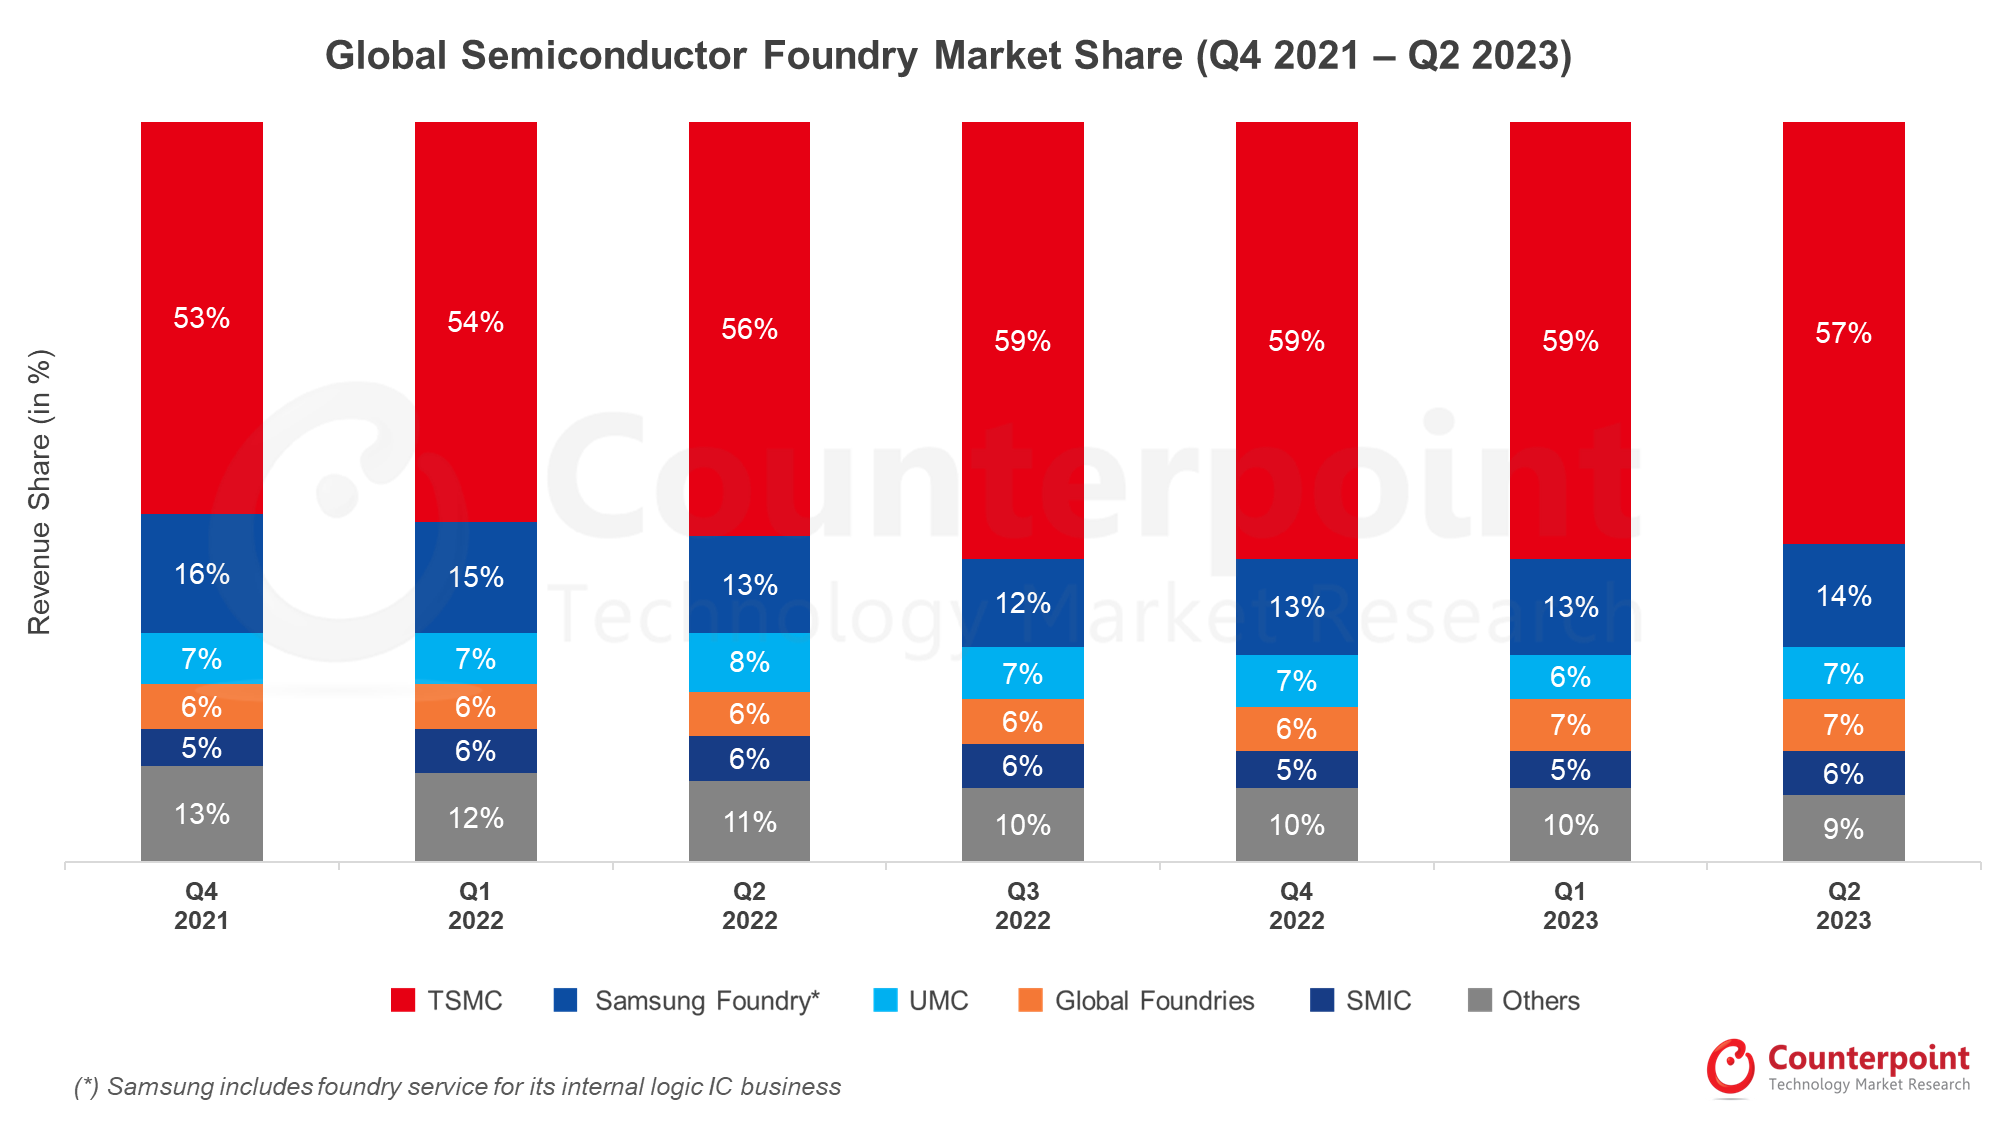
This page shows the quarterly revenue share for the top players in the global semiconductor foundry market from Q4 2021 to Q2 2023.
| Global Semiconductor Foundry Revenue Share (%) | Q4 2021 |
Q1 2022 |
Q2 2022 |
Q3 2022 |
Q4 2022 |
Q1 2023 |
Q2 2023 |
| TSMC | 53% | 54% | 56% | 59% | 59% | 59% | 57% |
| Samsung Foundry* | 16% | 15% | 13% | 12% | 13% | 13% | 14% |
| UMC | 7% | 7% | 8% | 7% | 7% | 6% | 7% |
| GlobalFoundries | 6% | 6% | 6% | 6% | 6% | 7% | 7% |
| SMIC | 5% | 6% | 6% | 6% | 5% | 5% | 6% |
| Others | 13% | 12% | 11% | 10% | 10% | 10% | 9% |
(*) Samsung includes foundry service for its internal logic IC business
This page provides a view on the global foundries revenue share from 2021 till 2023. Here are some highlights from Q2 2023:
- PC, smartphone and consumer electronics segments are projected to see a weaker-than-expected recovery in H2 2023 with no strong pick-up in demand.
- Automotive and industrial application segments, which showed signs of softness going into H2 2023, still remain relatively resilient.
- AI demand continues to be strong in H2 2023. However, general-server IC demand is suffering due to cannibalization from AI.
- H2 2023 is expected to see a mild recovery. The overall utilization rate hit the bottom in Q2 2023. 8-inch nodes continue to suffer due to ongoing inventory corrections in PMIC and MCU.
DOWNLOAD:
(Use the buttons below to download the complete chart)
![]()
![]()
Read our foundry quarterly report for Q2 2023 here.
For detailed insights on the data, please reach out to us at sales(at)counterpointresearch.com. If you are a member of the press, please contact us at press(at)counterpointresearch.com for any media enquiries.
![]()
Related Posts: