Top

iPhone 15 Sales Launch Day: Pro Max Demand High in US

  • Footfalls at Apple Stores in the US were up on the launch day for iPhone series sales, with the iPhone 15 Pro Max being the top model in demand.
  • Delivery times for all models are becoming longer compared to the iPhone 14 series launch.
  • eSIM activation process has become smoother with the second eSIM-only iPhone launch.
  • Apple Store executives are heavily pushing the gaming aspect of the new Pro series.

A picture of all the 4 models of the iPhone 15 series at an Apple Store

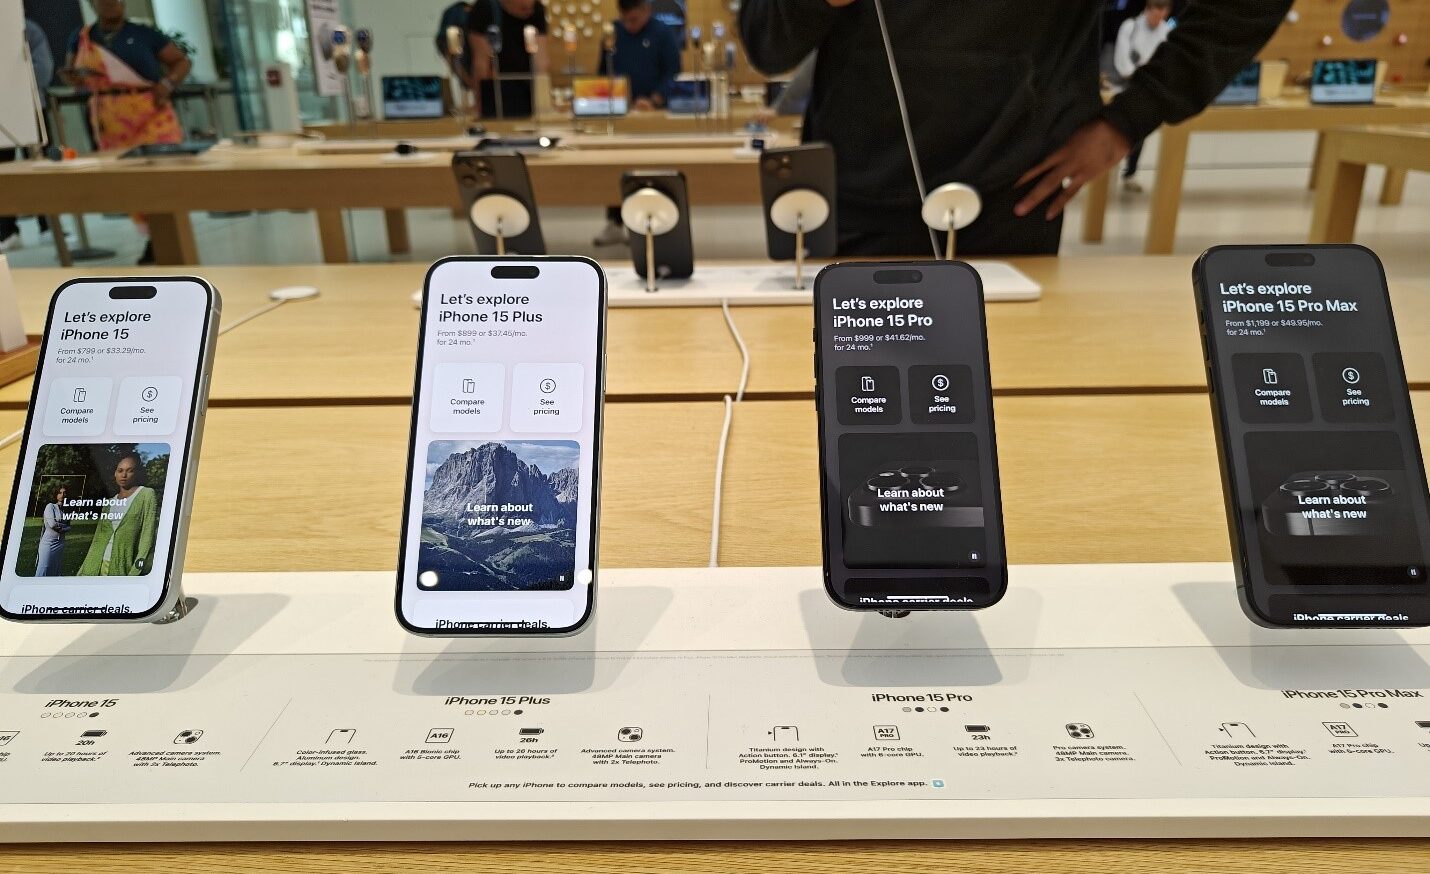
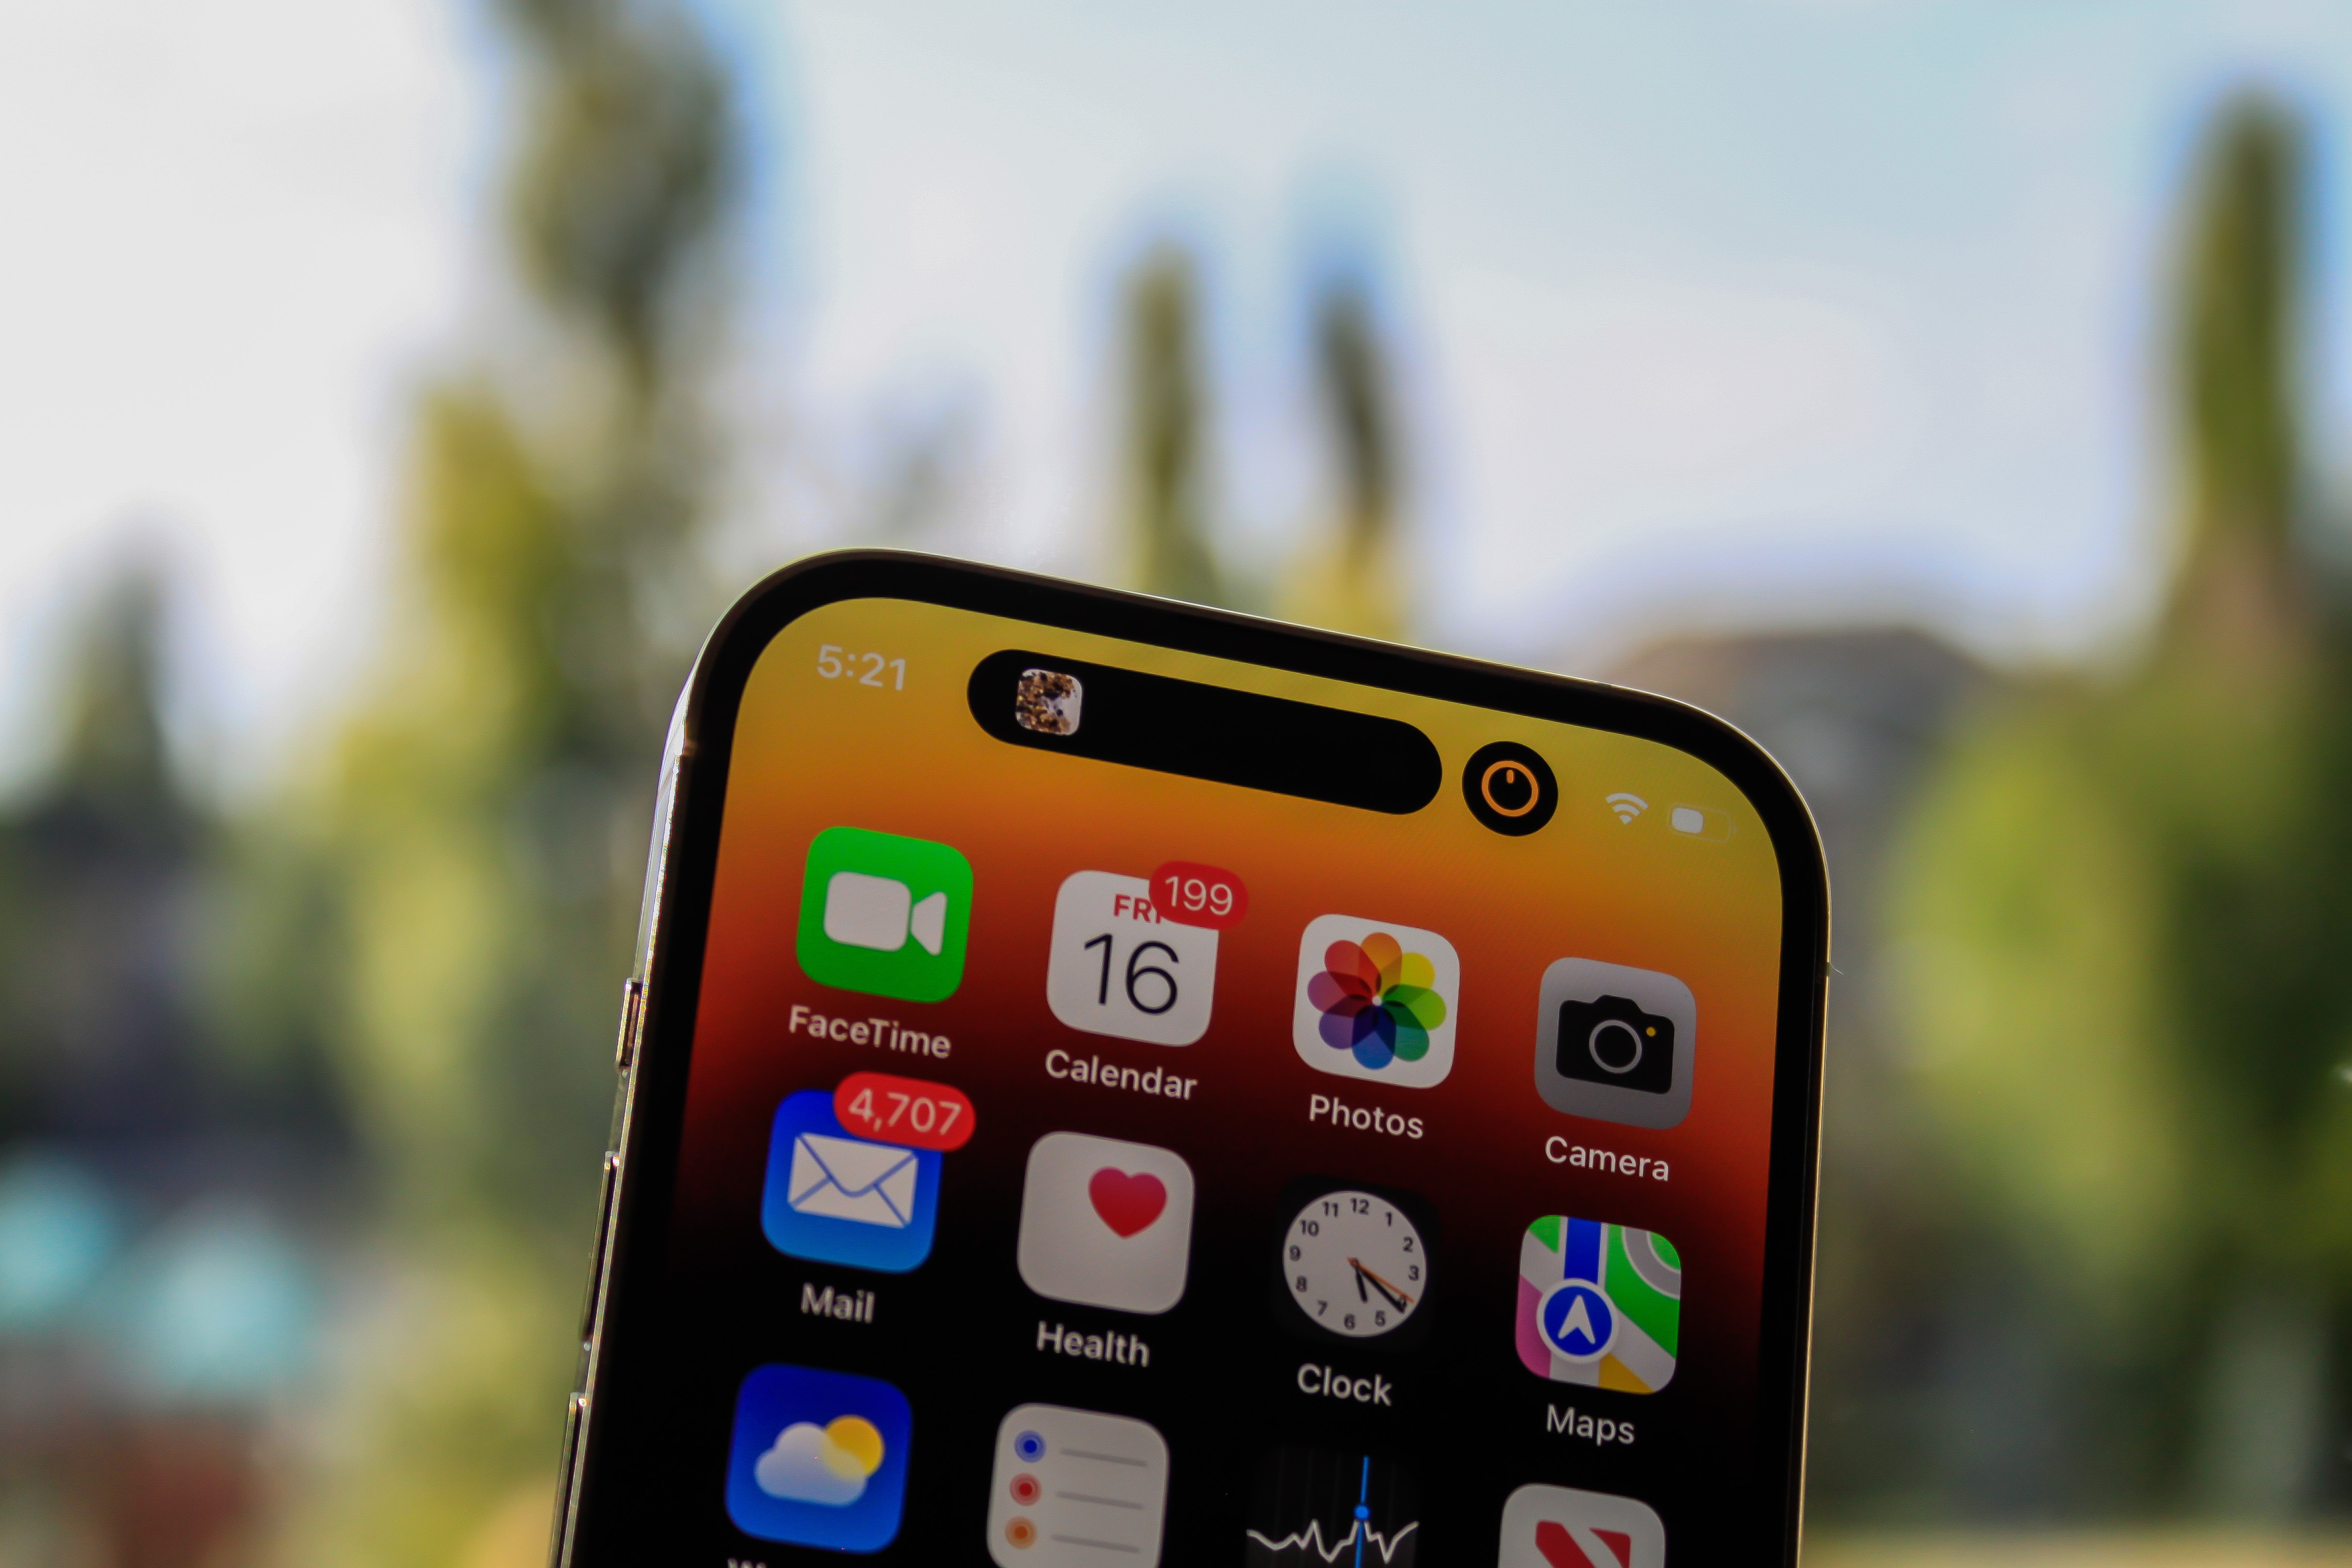
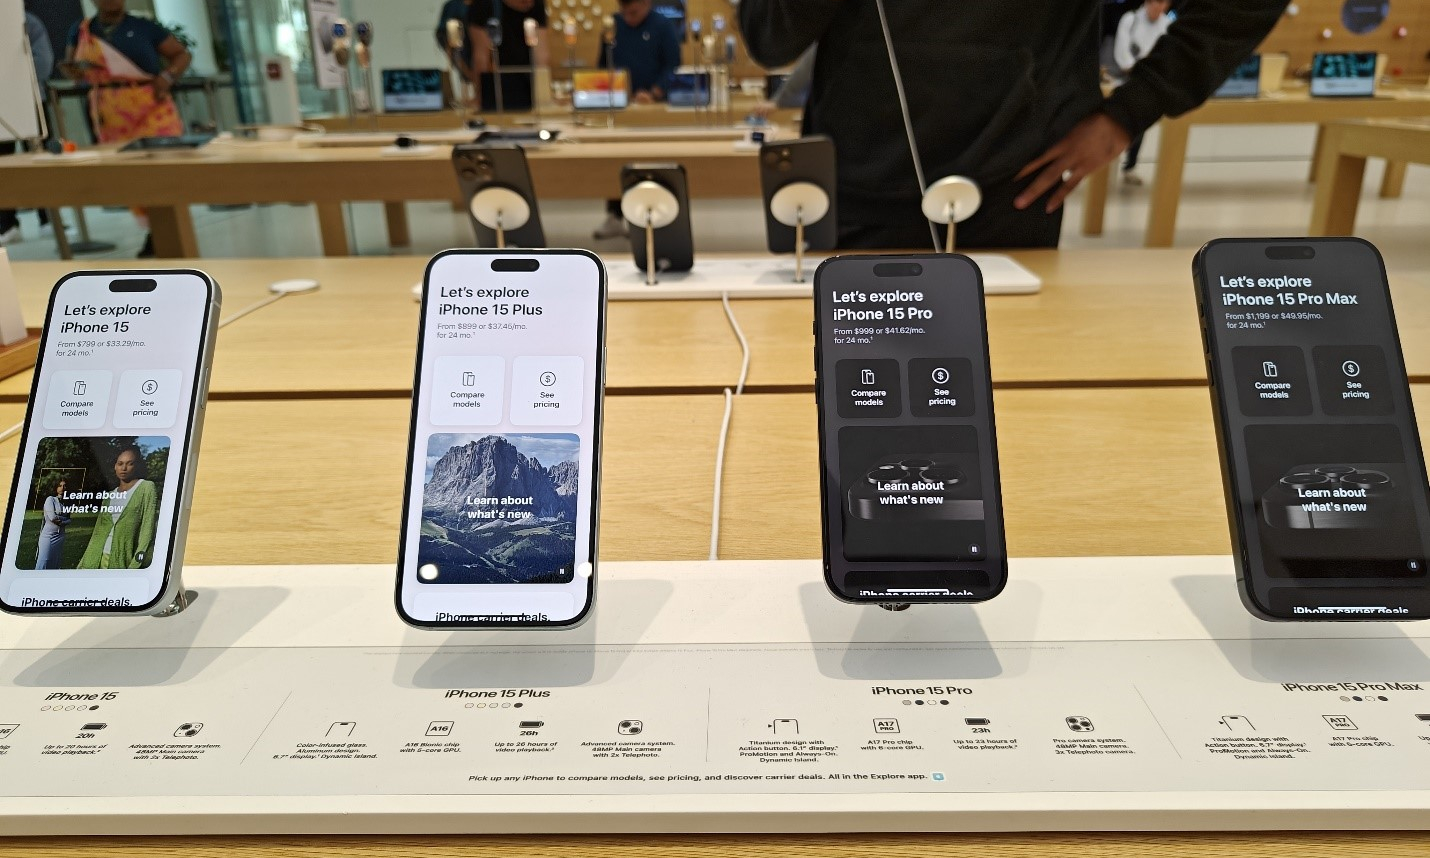
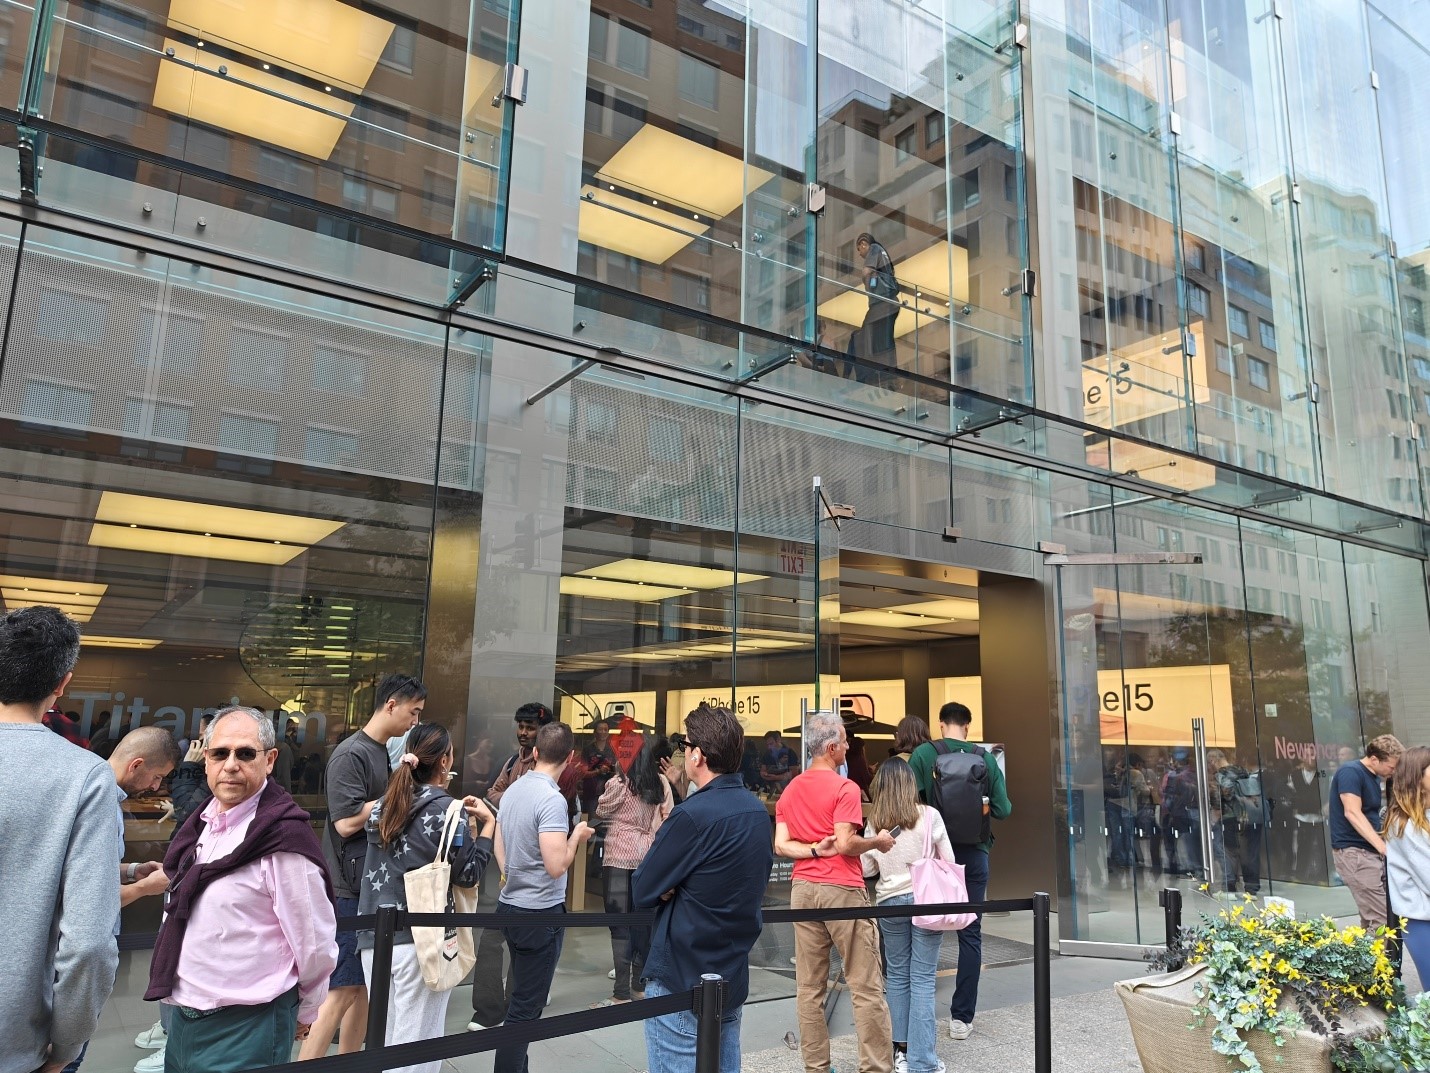
Apple Store sales for the iPhone 15 series started in the US on September 22, with people lining up outside the stores across the country to get their hands on the devices. This year felt a bit different compared to the previous three years –wait queues seemed to be much longer and more in-person shopping was done. Gone were the COVID-19 distancing measures and online-order pushes from Apple and carriers alike. Here are the five big takeaways from the sales launch day:

  • Store traffic for Apple locations is up while carriers see limited uptake: It seems we are back to waiting in long lines to purchase new Apple products during launch season. Just like last year’s launch, Tim Cook opened the sales at Apple’s 5th Avenue store in New York and greeted customers personally. Carrier stores, on the other hand, saw limited traffic and constrained iPhone inventory as Apple more tightly controls the supply during launch.

People outside Apple's 5th Avenue Store New York

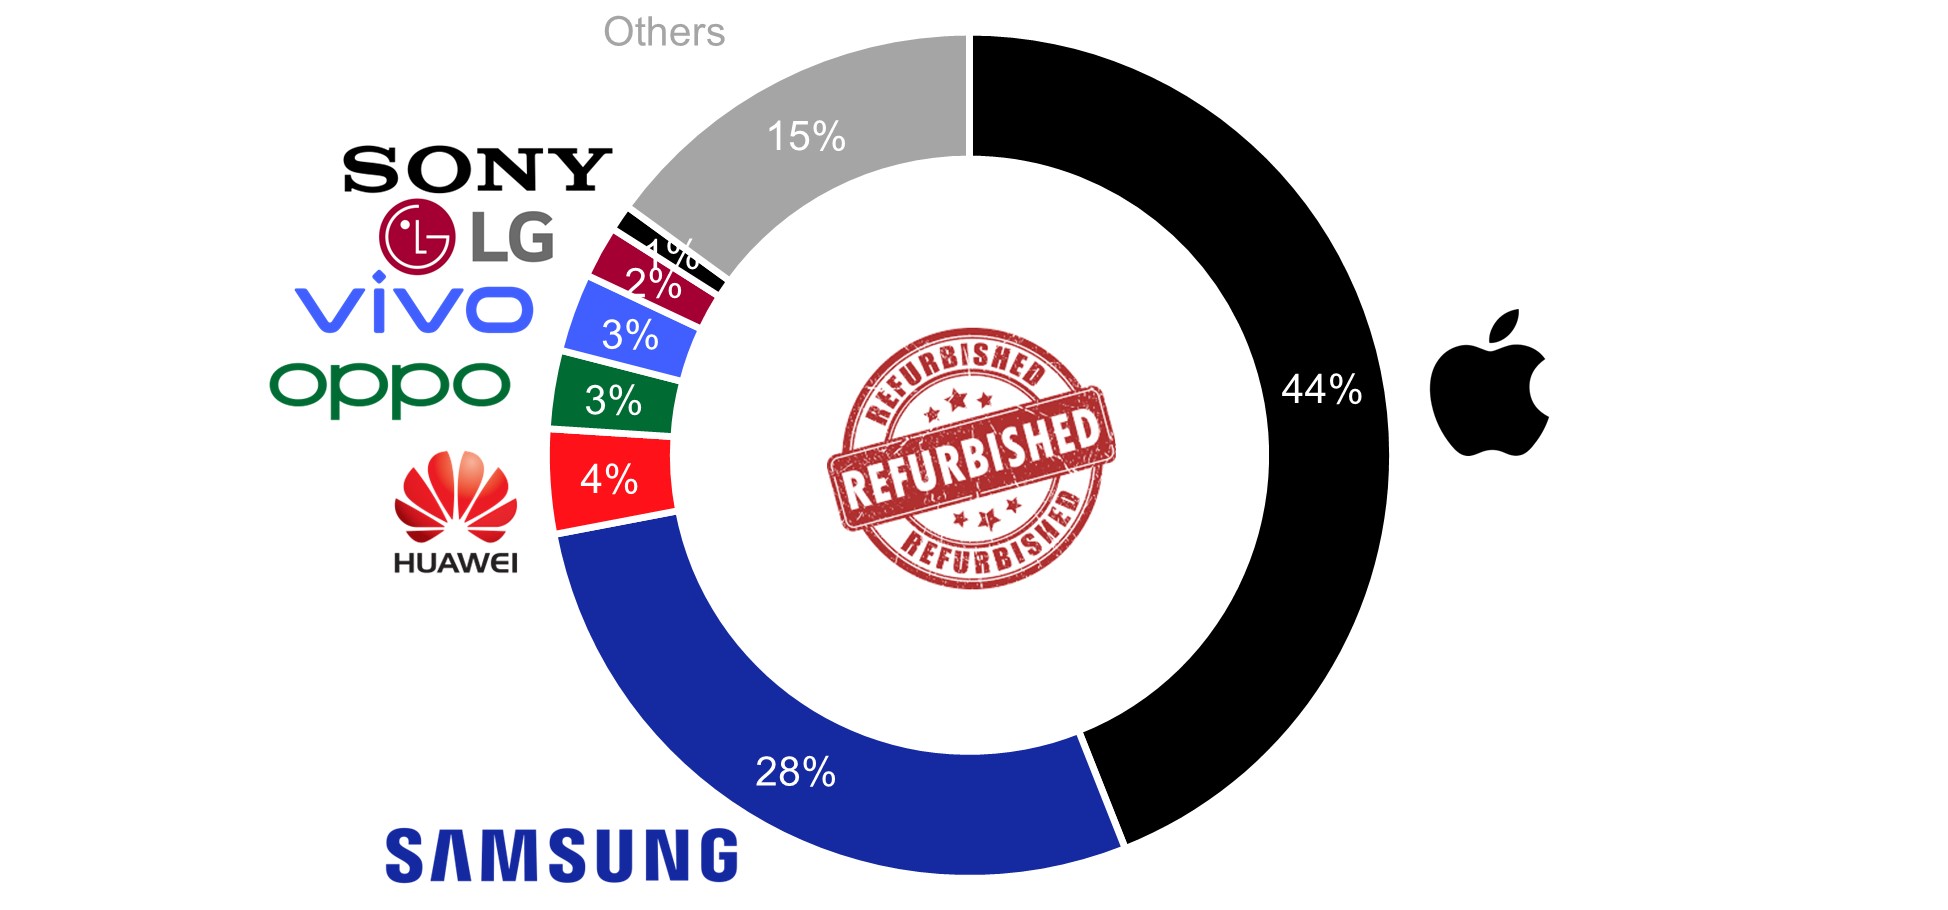
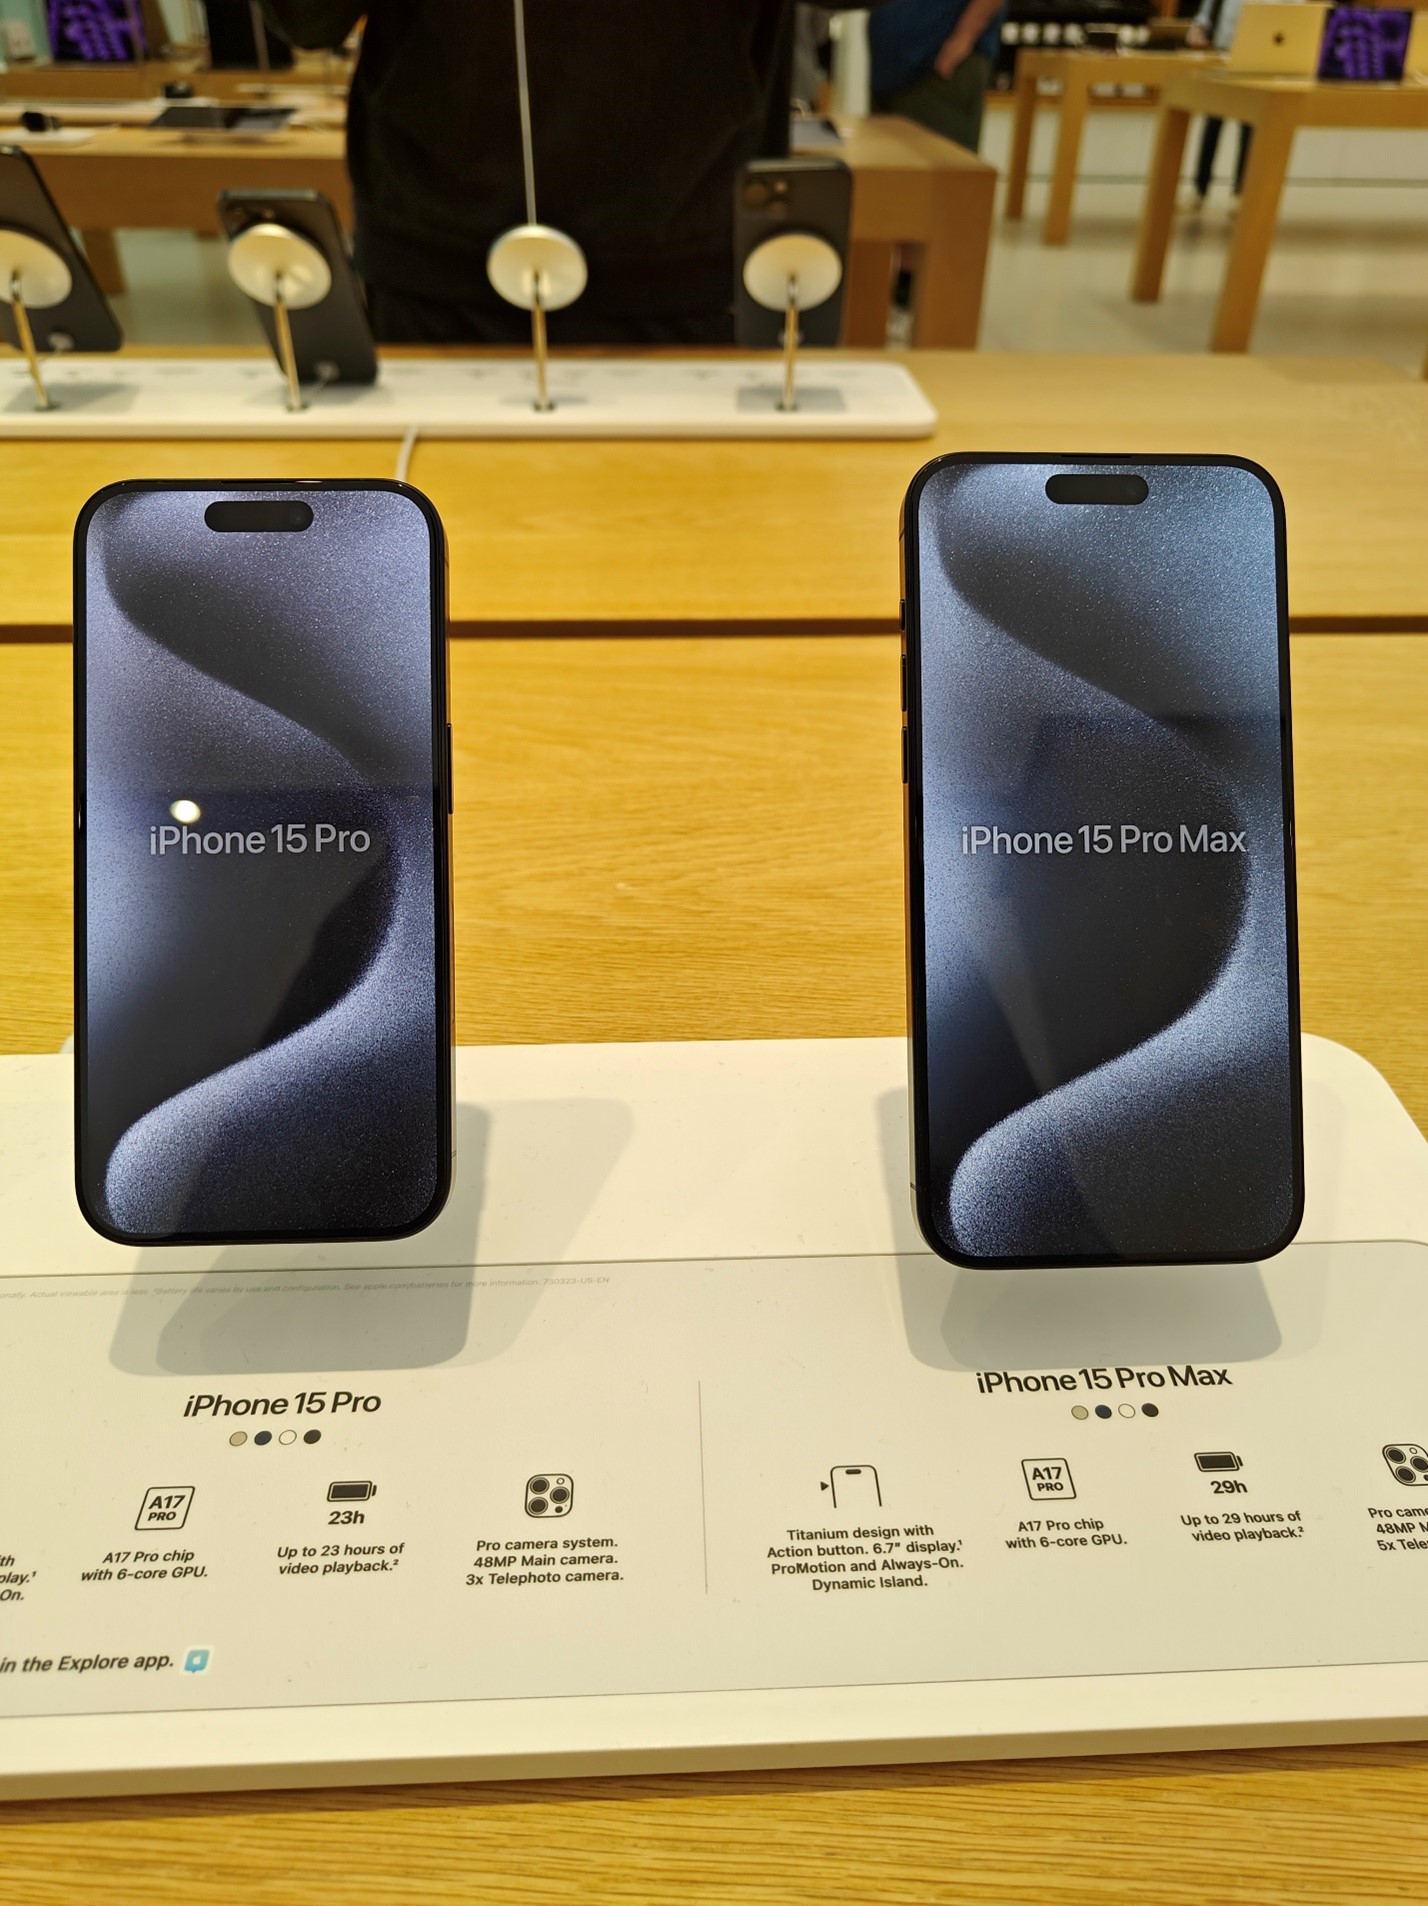
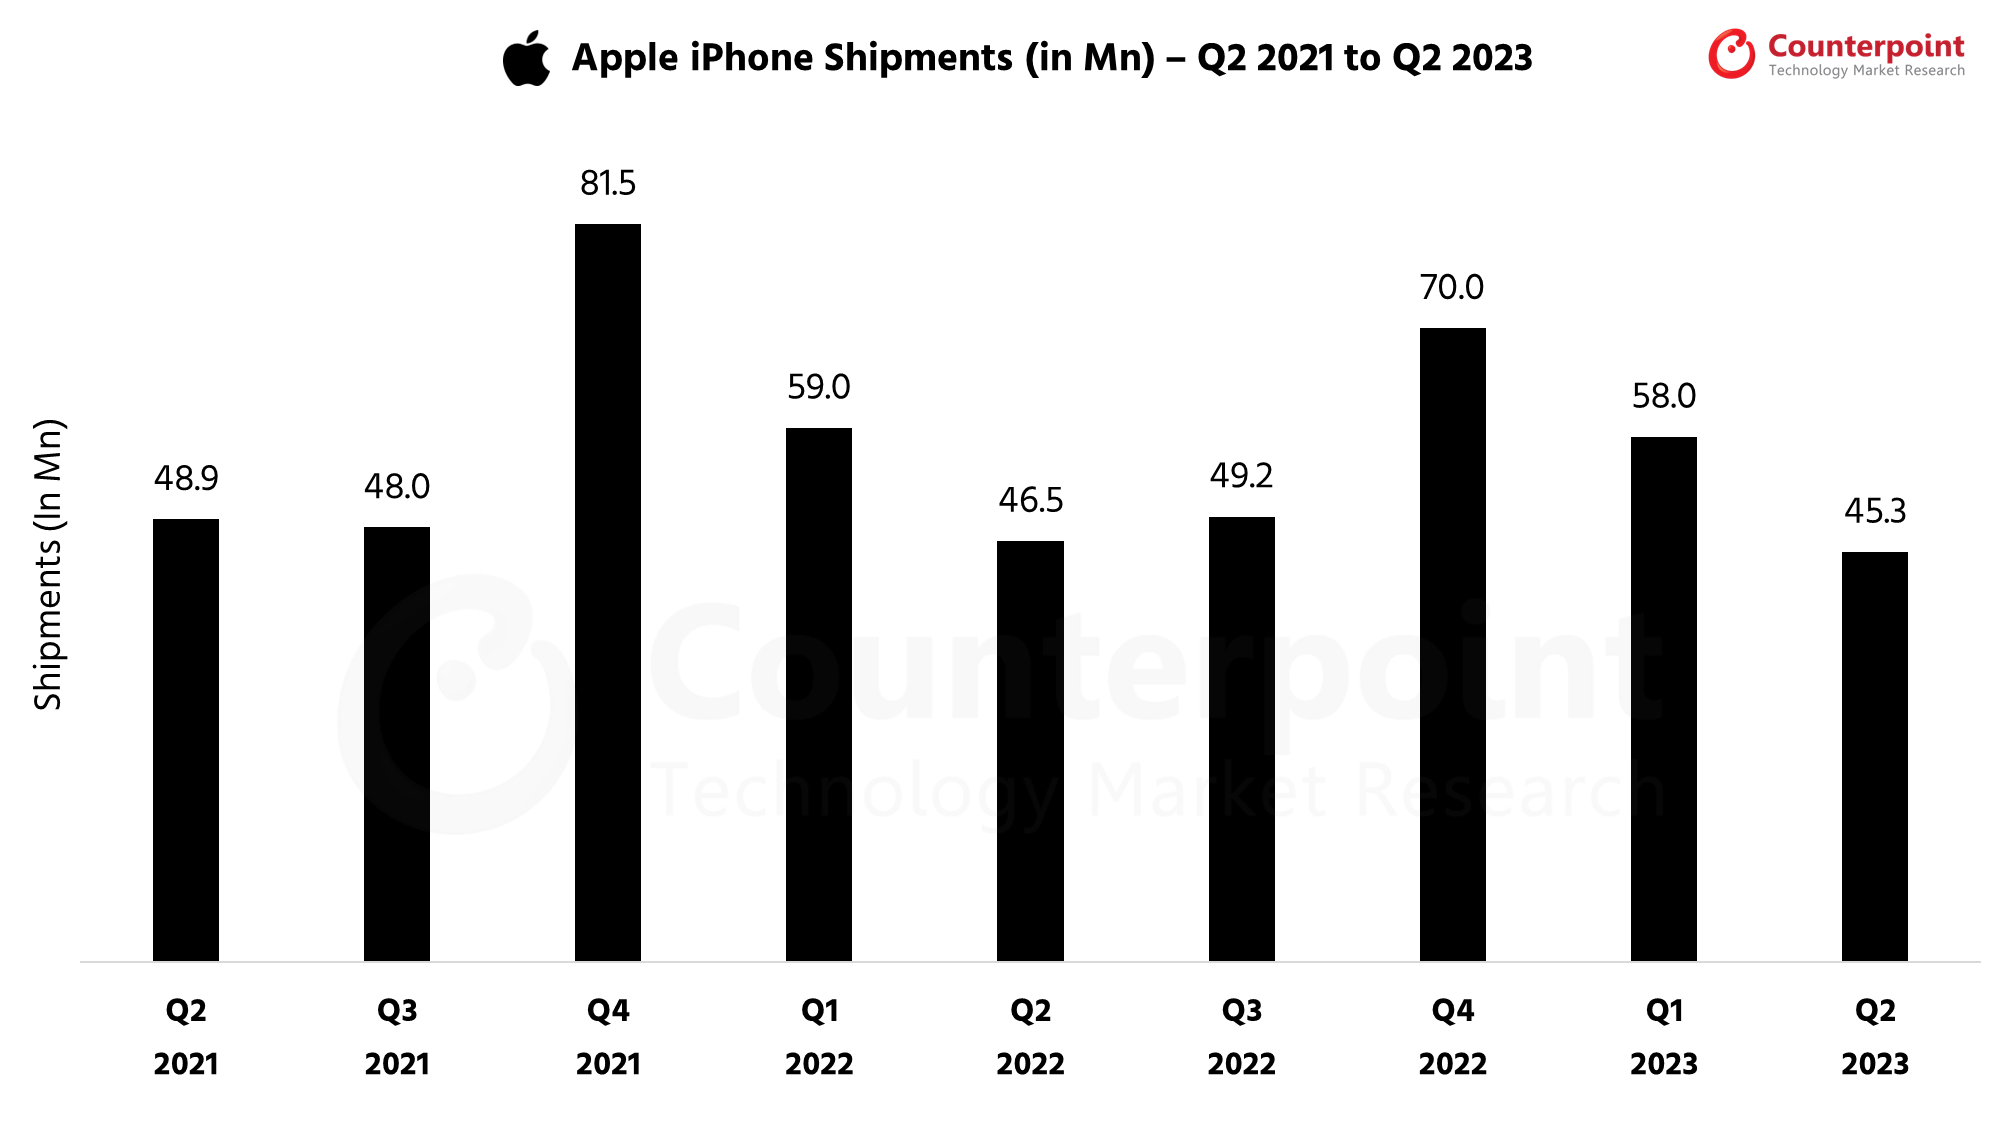
  • iPhone 15 Pro and Pro Max are selling out or very limited quantity remains: As we have seen in previous launches, the Pro versions tend to have stronger demand as early adopters eagerly wait to upgrade their devices. The iPhone 15 Pro Max is the top model in demand.

iPhone 15 Pro and Pro Max

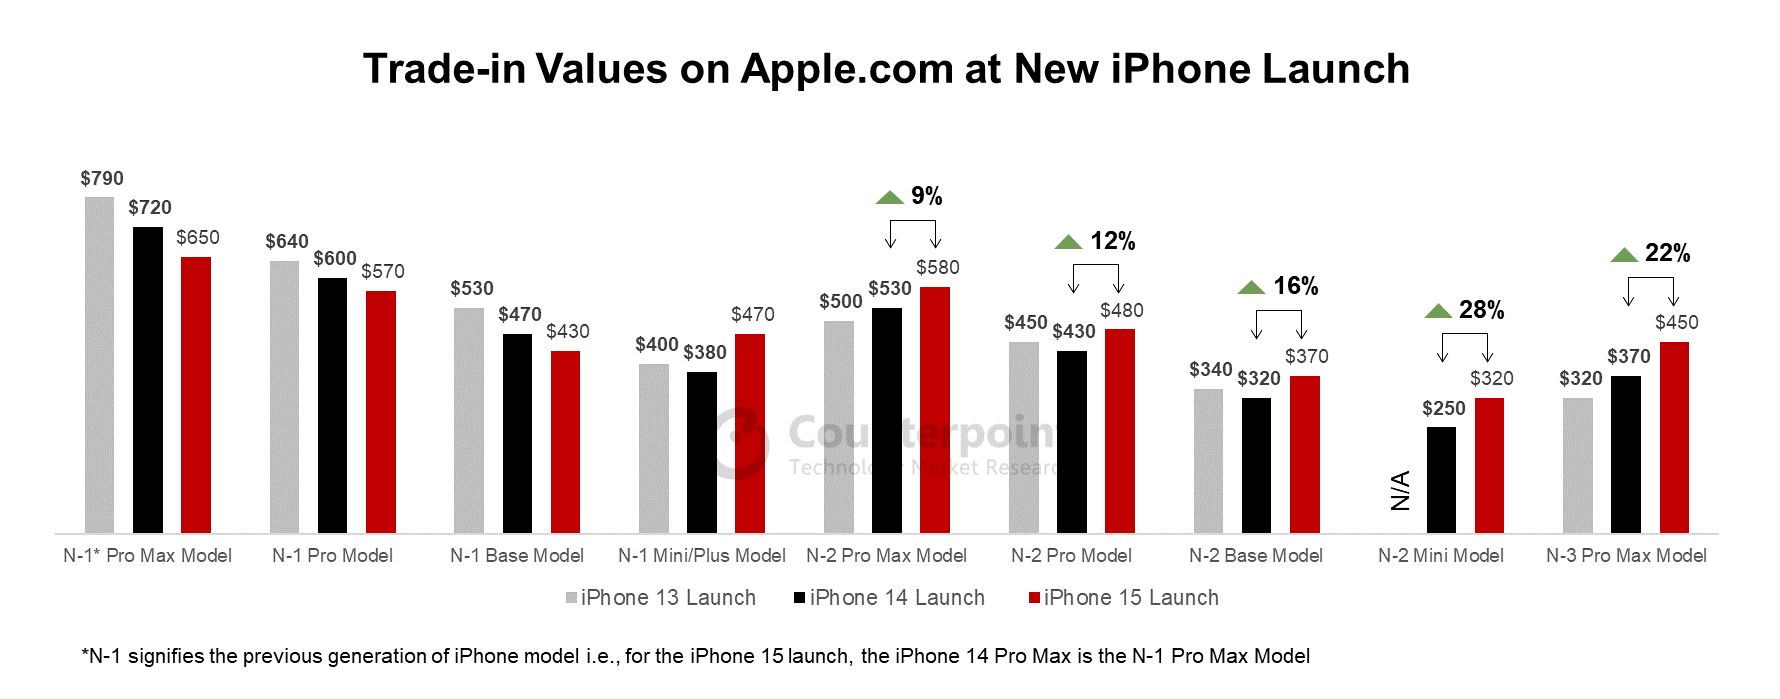
  • Delivery times are increasing, even for the base models: Demand for all iPhones has increased compared to last year. Apple is projecting delivery dates of October 4-9 for the iPhone 15 and 15 Plus models and October 23-30 for the Pro models on the launch day for the base memory configuration and black color models. In comparison, the iPhone 14 only had a slight lag of four days for delivery while the iPhone 14 Pro models saw delivery times in the 4-5-week range – similar to the iPhone 15 Pro models.
  • eSIM issues have largely subsided: When Apple first came out with eSIM-only iPhones last year, there were many issues with the initial transition from physical SIM swaps to eSIM. Carriers had to massively adjust their activation process and due to the large demand for iPhones during the launch, there were some bottlenecks that caused long delays for customers waiting to have their numbers transferred. Store representatives say this year the process has been much smoother and quicker.
  • iPhone 15 Pro Max is being heavily promoted as a gaming machine: Store representatives have been given several talking points around the iPhone 15 Pro Max’s gaming capabilities. From hardware-accelerated ray tracing and a new 6-core GPU to USB-C-enabled 4K gaming on an external monitor, the new Pro series devices are being pushed as viable alternatives to consoles and other Android devices alike.

Related Posts

First Price Increase of iPhone 15 Pro Max Since 2019: Apple Incentivizing Older Base to Upgrade

  • Apple has increased the price for its latest Pro Max model by $100 in the US.
  • Apple is offering better trade-in values for N-2 or N-3 devices compared to last year to help upgrade its older-generation base.
  • The Pro Max price increase to $1,199 is mostly a result of an upgrade to a titanium chassis as well as a telephoto camera.
  • iPhone 15 promotions are slightly worse compared to last year, especially with the higher price of the iPhone 15 Pro Max.

Apple has released its new iPhone 15 series, confirming the price increase for the Pro Max model by $100 in the US. This is the first time since the Pro series launched in 2019 that Apple has raised its prices. Apple’s carrier promotions have softened slightly compared to the iPhone 14 launch while trade-in values for N-1 devices (newest generation minus one, i.e. iPhone 14) have also decreased. Apple is offering better trade-in values for N-2 or N-3 devices compared to last year to help upgrade its older-generation base.

New pricing for Pro Max – Now at $1,199 for base model

The Pro Max price increase to $1,199 is mostly a result of an upgrade to a titanium chassis as well as a telephoto camera, which will allow for 5x optical zoom with a 120mm lens. The base model now also comes with 256GB of storage. This price increase may change consumer purchasing patterns and potentially have repercussions for Apple’s overall ASP as consumers may decide to purchase more affordable models this time around. It may be noted here that the 256GB iPhone 14 Pro Max also retailed for $1,199.

iPhone 15 pricing on Apple.com

US promotions decrease slightly

US carriers Verizon, T-Mobile and AT&T generally have the same top-line promotions for the highest tiered plans on Apple’s website as last year’s iPhone 14 launch. This means that both AT&T and T-Mobile will offer up to $1,000 off on devices with a qualifying trade-in and eligible plan. Verizon remains the outlier, offering a discount of only $800. However, Verizon and T-Mobile’s lower-tiered plans have seen a decrease in value. This means that iPhone 15 promotions are slightly worse compared to last year, especially with the higher price of the iPhone 15 Pro Max.

This comes at a time when carriers are seeing historically low upgrade rates and smartphone purchases are being delayed as consumers continue to face economic uncertainty. Nevertheless, we believe the iPhone 15 has the potential to be another big upgrade cycle for Apple, especially for the iPhone 11 and iPhone 12 owners as they look to upgrade their three- to four-year-old devices.

Trade-in Values Have Decreased for N-1 Models, But Apple is Pushing its Older Base to Upgrade

Apple.com Deals on iPhones

Although the discounts offered have largely remained the same, the pure trade-in values of N-1 devices have fallen, again. When the iPhone 13 series launched, customers could get a maximum of $790 in trade-in value for their old iPhone 12 Pro Max. This trade-in value dropped to $720 for the iPhone 13 Pro Max when the iPhone 14 series released last year. This year’s iPhone 15 launch saw trade-in values drop to $650 for the iPhone 14 Pro Max as the highest-value trade-in device.

Trade-in Values for iPhones on Apple.com

Compared to the years before, Apple is putting a stronger focus on offering better trade-in values for its N-2 and N-3 models such as the iPhone 13 series and iPhone 12 series. Trade-in values for N-2 models have increased 9%-28% YoY for this year’s launch. This also shows that Apple wants to incentivize customers to upgrade their older models to the latest iPhone 15 while signaling to the iPhone 14 users to hold off for now. In fact, these trade-in values could potentially be more attractive to customers than carrier deals, especially if they are not on the highest tiered plans available. This might lead to more customers purchasing an unlocked device directly from Apple rather than opting for a carrier promotion offered by Apple.

Related Posts

Apple iPhone Market Share: 2007 to 2023

Apple iPhone Shipments Market Share: 2007 to 2023

Published Date: August 21, 2023

A repository of annual and quarterly data for Apple iPhone market. This data is based on iPhone shipments by quarter that can help you understand the market scenario and Apple’s performance in the quarter.

Apple iPhone Shipments: Annual

Apple iPhone shipments (M units)
Year 2007 2008 2009 2010 2011 2012 2013 2014 2015 2016 2017 2018 2019 2020 2021 2022
Shipments 3.7 13.1 24.9 47.5 93 135.8 153.4 192.6 231.5 215.2 215.83 206.26 195.6 201.1 237.9 224.7

Apple iPhone Market Share: Annual

Apple iPhone market share
Year 2007 2008 2009 2010 2011 2012 2013 2014 2015 2016 2017 2018 2019 2020 2021 2022
Market Share 3% 9% 14% 15% 18% 18% 15% 15% 16% 14% 14% 14% 13% 15% 17% 18%

Apple iPhone Shipments: By Quarter 

Apple iPhone Shipments Q2 2023

Apple iPhone Shipments (in Millions)
Quarter Q2
2021
Q3
2021
Q4
2021
Q1
2022
Q2
2022
Q3
2022
Q4
2022
Q1
2023
Q2
2023
Shipments (in Mn) 48.9 48 81.5 59 46.5 49.2 70 58 45.3

DOWNLOAD:

(Use the buttons below to download the complete chart)
    

Apple iPhone Market Share: By Quarter

Apple iPhone Shipments Market Share Q2 2023

Apple iPhone Shipments Market Share (%)
Quarter Q2
2021
Q3
2021
Q4
2021
Q1
2022
Q2
2022
Q3
2022
Q4
2022
Q1
2023
Q2
2023
Shipments Market Share (in %) 15% 14% 22% 18% 16% 16% 23% 21% 21%

DOWNLOAD:

(Use the buttons below to download the complete chart)
    

Source: Counterpoint Apple iPhone Shipments Market Tracker

Apple Market Share Analysis:

  • Apple retained the second spot globally, with smartphone shipments declining by 22% QoQ and 3% YoY, to 45.3 million units in Q2 2023.
  • Apple captured 55% market in the US and 46% in Japan, becoming the top smartphone vendor in both these countries.

For a more detailed Apple iPhone shipments tracker, click below:


Apple iPhone Sell-in vs Sell-through and ASP Q1 2017 to Q2 2023

Counterpoint Research uniquely tracks both sell-in and sell-through of mobile handsets in the market, giving a broader perspective of the market dynamics. This report covers quarterly sell-in vs sell-through of Apple iPhone models along with average selling price (ASP). The report provides global iPhone shipment and sales by quarter helping clients to understand the demand/supply scenario for the individual models.

Contact Us Read More


For detailed insights on the data, please reach out to us at sales(at)counterpointresearch.com. If you are a member of the press, please contact us at press(at)counterpointresearch.com for any media enquiries.

Related Posts:


Related Posts

2023 Global Smartphone Shipments to Hit Decade Low As Apple Inches Closer to Top Spot

  • 2023 is on track to be the worst year for global smartphone shipments in ten years
  • Regional macro risks are extending smartphone replacement rates to record levels
  • Asia ex-China/India, North America and China likely biggest drivers of negative growth, respectively
  • Apple best positioned amongst key OEMs and could become #1 brand for first time ever
  • We remain cautious on Q1 2024 and see elevated risk of a delayed recovery into 2024 

Boston, Seoul, Beijing, New Delhi, London – August 17, 2023

According to preliminary figures from Counterpoint Research’s latest Global Smartphone Shipment Forecast, 2023 shipments are forecast to decline 6% to 1.15bn units, the lowest in a decade.

Asia is one of the major hurdles to positive growth, as headwinds halt the economic turnaround anticipated for China at the start of the year, and the broader region experiences intensifying declines across emerging markets.

As well, North America continues to be a major drag on global recovery, with a disappointing 1H setting it up for double-digit full year declines. Despite strength in the jobs market and inflation falling, consumers are hesitant to upgrade their devices, pushing replacement rates for the US and globally to record highs.chart“There’s been a decoupling between what’s happening in the economy and consumers buying phones. So far this year it’s been record low upgrades across all carriers,” says Jeff Fieldhack, Research Director for North America.

“But we’re watching Q4 with interest because the iPhone 15 launch is a window for carriers to steal high-value customers. And with that big iPhone 12 installed base up for grabs promos are going to be aggressive, leaving Apple in a good spot.”

In China, “Apple is well positioned as the premium segment continues to gain more share.” states Ethan Qi, Associate Director for China.

Premium and ultra-premium growth is a trend that is happening globally and favors vendors like Apple which have portfolios heavily weighted in the higher segments.

2023 could mark the start of a new era for Apple as a resilient premium market and strong showing in the US could help it become number one globally in terms of annual shipments for the first time ever.  “It’s the closest Apple’s been to the top spot.  We’re talking about a spread that’s literally a few days’ worth of sales,” muses Fieldhack. “Assuming Apple doesn’t run into production problems like it did last year, it’s really a toss up at this point.”

Background

Counterpoint Technology Market Research is a global research firm specializing in products in the TMT (technology, media and telecom) industry. It services major technology and financial firms with a mix of monthly reports, customized projects and detailed analyses of the mobile and technology markets. Its key analysts are seasoned experts in the high-tech industry.

Analyst Contacts

Jeff Fieldhack

Ethan Qi

Follow Counterpoint Research

Related Posts

Under-30 South Korea Survey: 85% Bought Android as First Phone; Now 53% on iOS

  • About 85% of South Korean smartphone users aged less than 30 had an Android phone as their first smartphone, but 53% of them now use iPhones.
  • The biggest reason for these Android phone users to switch to iPhones was expectations related to performance, particularly the camera.
  • On the other hand, 92% of users in the same age group who used an iPhone as their first smartphone are currently using an iPhone.

About 85% of South Korean smartphone users aged less than 30 used Android phones such as Samsung and LG as their first smartphones, according to a consumer survey conducted by Counterpoint Research among 1,000 users in the first half of 2023. However, about 53% of them said that they were currently using an iPhone, suggesting that many Android phone users had switched to iPhones during replacement.

The reason why Android phones account for a very high proportion of first-time smartphone purchases in South Korea is that most users in that age group, particularly adolescence, give priority to the preference of those with real purchasing power, such as parents, when buying their first smartphone. During the survey, the largest number of respondents opted for “Recommendation from family or friends” when asked why they used an Android as their first smartphone.

Smartphone OS Switching Pattern in South Korea

first smartphone brand in life
Source: Counterpoint Smartphone User Experience by OS in Korea Report, H1 2023

As for the reason for switching from an Android phone to an iPhone, respondents cited “Performance” (32%) and “Brand image” (31%) as the first and second priorities. In particular, in terms of performance, satisfaction and expectation with the camera had the greatest impact on the purchase decision. Apple operates a number of R&D centers specializing in imaging technology and is evaluated to have maximized the camera performance of its devices by achieving good harmony between hardware and software. Besides, Apple recently launched a campaign called ‘Shot on iPhone’ in the South Korean market. The campaign emphasizes the iPhone’s camera performance through collaboration with a music video by Korean girl group NewJeans and a short film by director Park Chan-wook.

apple iphone
Source: Apple

According to the survey, in the <30 age group user base, Apple seems to have succeeded in solidifying the loyalty of existing iPhone users as well as switchers from Android phones. 92% of users who owned an iPhone as their first-ever smartphone said they were still using the brand. Furthermore, about 76% of them said they were not willing to use Android phones in the future. The respondents cited dissatisfaction with Android phones’ “Design” (52%) and “Performance” (29%) as reasons.

When considering all age groups, more than half of the respondents who said they switched from iPhone to Android cited easy-to-use features such as Samsung Pay and UI as the differentiating factors. These answers were similar to those of current iPhone users, who said they were willing to replace their devices with Android smartphones in the future. Therefore, to attract new users and secure loyal customers, marketing strategies that focus on user convenience are expected to be effective for Android smartphone brands.

US Smartphone Shipments Decline in Q1 2023 Amid High Inflation, Inventory Correction; Apple Share Up

  • Shipments declined 17% YoY in Q1 2023 due to inventory correction and weak consumer demand.
  • Apple increased its market share to 53% in Q1 2023 from 49% in Q1 2022.
  • The uncertain economic outlook forced consumers to hold off on new device purchases.
  • Some niche categories like foldables may continue to perform well despite overall weakness.
  • Incumbent postpaid players may increase promotional activity during H2 to take on cable MVNOs.

Denver, Boston, Toronto, London, New Delhi, Hong Kong, Beijing, Taipei, Seoul – May 8, 2023

Smartphone shipments in the US declined 17% YoY in Q1 2023 as OEMs corrected high channel inventory and as consumer demand declined due to macroeconomic pressures. The market witnessed a dip in shipments across all major OEMs after registering a strong first quarter last year. However, Apple managed to increase its market share despite a YoY drop in its shipments.

Counterpoint-Research-US-Smartphone-Shipments-Q1-2023Counterpoint US OEM Share Q1 2023

Commenting on the situation, Research Analyst Matthew Orf said, “Inflation started impacting the US smartphone market in H2 2022, especially the low end where consumers have less disposable income and are more sensitive to changes in prices. Persistent inflation and an uncertain economic outlook are causing consumers to hold off on new device purchases, resulting in lower upgrade rates and fewer device sales, especially in the prepaid segment.”

The impact of inflation and other macroeconomic pressures on the market has been uneven. Senior Analyst Maurice Klaehne noted, “While prepaid brands saw significant YoY declines in shipments, there were some silver linings. Samsung’s Galaxy S23 shipments were up double digits YoY while the Galaxy A14 5G performed exceptionally well in prepaid. The gap between low-end and premium devices seems to be widening, creating a vacuum in the mid-range device category.”

Associate Research Director Hanish Bhatia noted, “Some niche categories may continue to perform well despite overall weakness. For instance, there is a lot of excitement around foldables this year as more OEMs jump onto the bandwagon, which may stir demand for premium devices. Similarly, demand from government-supported Lifeline and ACP programs will largely remain unaffected. But at a broader level, Android-to-iOS migration driven by young and first-time smartphone users continues to remain a key pain point among Android OEMs.”

Commenting on the direction of the US smartphone market, Director of North America Research Jeff Fieldhack said, “During Q1 2023, there was sluggish consumer demand with very low upgrades. We expect the incumbent postpaid players to increase promotional activity during the second half of the year to combat cable MVNOs, which saw higher net additions than the Big 3 during the quarter, a first for the US market.”

Feedback or a question for the analyst that wrote this note?


Matthew Orf

Research Analyst

Please enable JavaScript in your browser to complete this form.

Background 

Counterpoint Technology Market Research is a global research firm specializing in products in the technology, media and telecom (TMT) industry. It services major technology and financial firms with a mix of monthly reports, customized projects and detailed analyses of the mobile and technology markets. Its key analysts are seasoned experts in the high-tech industry.

Analyst Contacts 

Matthew Orf

Counterpoint Twitter

Maurice Klaehne

Counterpoint Twitter

Hanish Bhatia

Counterpoint Twitter

Jeff Fieldhack

Counterpoint Twitter

Follow Counterpoint Research

Counterpoint Twitter


Further Reading: 

Global Smartphone Market Declines 14% YoY in Q1 2023; Apple Records Highest-Ever Q1 Share

China Smartphone Sales Fall 5% YoY in Q1 2023; Apple on Top with Highest Sales Share

India Smartphone Market Records Highest Ever Q1 Decline of 19%, 5G Smartphones Contribution at 43%


BoM Analysis – iPhone 14 Pro Max Costs 3.7% More to Make Than iPhone 13 Pro Max

  • The blended bill of materials (BoM) cost for the iPhone 14 Pro Max with 128GB Nand flash is about $464, a 3.7% increase from that of the iPhone 13 Pro Max.
  • In the iPhone 14 Pro Max, Apple’s self-designed chips accounted for over 22% of the total BoM cost. Apart from the A16 bionic processor, Apple’s self-designed chips include PMIC, audio, connectivity and touch control.
  • The upgrade to the A16 Bionic chipset from the A15 Bionic resulted in an $11 cost increase, driving the processing group’s cost share to 20% in BoM.
  • The new main camera with a 48MP image sensor and the screen with an always-on display feature drive the cost increase.

Producing a 128GB iPhone 14 Pro Max mmWave smartphone costs Apple up to $474, according to Counterpoint Research’s BoM analysis. The BoM cost of the sub-6GHz model comes to $454. Assuming a 44% mmWave mix (by the end of 2022), the blended materials cost for the iPhone 14 Pro Max is about $464, a 3.7% increase over that of the iPhone 13 Pro Max. The application processor, display and camera are the main categories where cost has increased. These components now also command a larger share in the BoM.

Iphone 13 Pro Max and IPhone 14 Pro Max BOM Share

Counterpoint Smartphone BoM Master File

Apple’s first 4nm process-powered application processor

Apple’s new-generation mobile processor, the A16 bionic, contains a whopping 16 billion transistors, a 6.7% increase from the A15’s 15 billion transistors. This facilitates improved CPU, GPU, neural engine and camera ISP performances. Due to its more advanced 4nm process, the application processor alone is estimated to introduce a cost increase of $11, driving the processing category’s share to 20% in BoM cost.

Display upgrade with always-on feature

Apart from upgrading the peak brightness in HDR mode and outdoor mode, Apple has added an always-on display feature in the iPhone 14 Pro Max. The feature makes the display easy to view when the lock screen is on. All the upgrades together have increased the display category’s . The panels used in the iPhone 14 Pro Max are supplied by Samsung.

48MP CIS upgrade on main camera

The iPhone 14 Pro Max has a 48MP main camera with a quad-pixel image sensor with a sensor area that is 65% larger than that in the iPhone 13 Pro Max. The main camera’s sensor-shift stabilization has also been upgraded to the second generation in the iPhone 14 Pro Max. Sony supplies the image sensor for Apple. Sunny Optical, Largan Digital and GSEO are the suppliers for the main camera’s 7P lens, while LG Innotek supplies the module. The front camera has been improved with the addition of the auto-focus feature while its lens has been upgraded to 6P from the 5P present in the iPhone 13 Pro Max. GSEO and Sunny Optical are the main suppliers of the front camera lens. These upgrades together have driven the camera category cost up by $6.30 in the iPhone 14 Pro Max.

Cellular group cost drop

Compared with that of its predecessor, the iPhone 14 Pro Max’s blended cellular group cost share dropped to 13% due to a fall in component prices as 5G cellular technology rises in popularity. Qualcomm, Qorvo, Skyworks, Broadcom and are component suppliers in the cellular category for the iPhone 14 Pro Max.

Diversified sources of supply

Apple continues to diversify its supply sources. KIOXIA and SanDisk supply the NAND flash for the iPhone 14 Pro Max, while SK hynix, Samsung and Micron supply the LPDDR5. NXP and Broadcom remain suppliers of wireless connections, display and touch control solutions for the device. Cirrus Logic, Goertek, Knowles and AAC dominate the audio-related design. TI and ST Micro are major suppliers of power and battery management IC in the iPhone 14 Pro Max.

Self-designed components’ cost share rise

Apple’s self-designed components have a larger share in the overall BoM cost of the iPhone 14 Pro Max than in that of the iPhone 13 Pro Max. Apart from the A16 bionic processor, Apple’s self-designed chips include PMIC, audio, connectivity and touch control. Our estimate suggests that Apple’s self-designed components account for 22% of the overall BoM cost of the iPhone 14 Pro Max.


Background

Counterpoint Technology Market Research is a global research firm specializing in products in the technology, media and telecom (TMT) industry. It services major technology and financial firms with a mix of monthly reports, customized projects and detailed analyses of the mobile and technology markets. Its key analysts are seasoned experts in the high-tech industry.


Analyst Contacts:

Shenghao Bai

Related Posts

ASP Rise of 10% YoY Limits Q3 2022 Global Handset Revenue Fall to 3% YoY

  • Global handset revenues declined 3% YoY despite a subdued market where shipments fell 12% YoY.
  • A steeper revenue decline was prevented by a 10% YoY revenue growth of Apple.
  • Consequently, the 5G revenue share reached an all-time high of 80%.
  • With China being the single biggest market for OPPO* and vivo, the ongoing COVID-19 and economic issues in the country resulted in a significant revenue decline YoY.

London, New Delhi, Hong Kong, Seoul, Beijing, San Diego, Buenos Aires – December 21, 2022

The global smartphone handset market’s revenue declined 3% YoY in Q3 2022 to just above $100 billion, according to the latest research from Counterpoint’s Market Monitor Service. A 10% YoY growth was seen in the average selling price (ASP) thanks to the premium handset segment’s greater resilience to economic uncertainty. The record shipment contribution (46%) of 5G handsets, which cost five times an average non-5G handset, also added to the ASP and revenue growth. In terms of shipments, the overall handset market saw a 12% YoY decline during the quarter.

Commenting on the 5G effect on ASP growth, Senior Analyst Harmeet Singh Walia said, “At over $80 billion, the revenue contribution of 5G handsets reached an all-time high of 80% of global handset revenues, up from 69% in the third quarter of last year. In the same period, LTE handsets’ revenue contribution fell 10% to $19 billion. This shift from 4G to 5G has been led by Apple, which alone makes up for over half of all 5G revenues as over 95% of its phones are 5G-enabled. Apple saw a 10% YoY revenue growth and 7% YoY ASP growth in Q3 2022, contributing to an overall increase in global handset ASP. This is thanks in part to the launch of the iPhone 14 series as well as the Pro models, especially from the previous generation, doing well.”


Samsung, the second biggest handset OEM in terms of revenue, saw a relatively modest ASP increase of 2% YoY in Q3 2022 despite an almost doubling of the shipments of its premium Flip and Fold series in the same period as well as a 27% YoY revenue growth of its 5G smartphones. The lower growth of its ASP can be attributed to a shift in its focus from the more successful S22 series to the still upcoming foldable series. Consequently, Samsung’s revenue declined 4% YoY in Q3 2022.

Xiaomi’s handset revenue grew 4% YoY, a significant portion of which came from the low-to-mid price bands. The shipment share of the over-$300 price band declined by close to 1.5%. There was, however, a significant shift from the sub-$200 to $200-$299 price band. Consequently, Xiaomi’s ASP grew 14% YoY to $205.

OPPO*, on the other hand, saw an ASP as well as a revenue decline of 5% and 27% YoY respectively. The revenue decline was primarily caused by OPPO’s shipment decline in COVID-hit China, which contributed over 40% to its total shipments in Q3 2022. Given that China contributed over half of vivo’s total shipments, its revenue took an even bigger hit of 43% YoY despite growing 4% QoQ.

*OPPO includes OnePlus from Q3 2021

Feel free to reach us at press@counterpointresearch.com for questions regarding our latest research and insights.


You can also visit our Data Section (updated quarterly) to view the smartphone market share for WorldUSChina and India.


Related Posts


Background

Counterpoint Technology Market Research is a global research firm specializing in products in the TMT (technology, media and telecom) industry. It services major technology and financial firms with a mix of monthly reports, customized projects and detailed analyses of the mobile and technology markets. Its key analysts are seasoned experts in the high-tech industry.


Harmeet Singh Walia

 Twitter Logo - PNG and Vector - Logo Download  

Amulya Pulstya

 Twitter Logo - PNG and Vector - Logo Download  

Tarun Pathak

 Twitter Logo - PNG and Vector - Logo Download  

Jan Stryjak

 Twitter Logo - PNG and Vector - Logo Download  

Follow Counterpoint Research
 Twitter Logo - PNG and Vector - Logo Download  

Global Smartphone Market at Lowest Q3 Level Since 2014

  • The global smartphone market declined by 12% YoY even as it grew by 2% QoQ to reach 301 million units in Q3 2022.
  • While quarterly growth in Apple and Samsung pushed the global smartphone market above 300 million units, a level it failed to reach last quarter, political and economic instability drove negative consumer sentiment.
  • Apple was the only top-five smartphone brand to grow YoY, with shipments increasing 2% YoY, growing market share by two percentage points to 16%.
  • Samsung’s shipments declined by 8% YoY but grew 5% QoQ to 64 million.
  • Xiaomi, OPPO* and vivo, recovered slightly after receiving heavy beatings due to lockdowns in China in Q2, and as they captured more of the market ceded by Apple and Samsung’s exit from Russia.

London, New Delhi, Hong Kong, Seoul, Beijing, San Diego, Buenos Aires – October 28, 2022

The global smartphone market remained under pressure given deteriorating economic conditions with shipments declining by 12% year-on-year, reaching 301 million units in Q3 2022, according to the latest research from Counterpoint’s Market Monitor service. Ongoing international political tensions resulting in economic uncertainty hit the smartphone market even though it reversed its slide below the 300-million-mark last quarter thanks to a slight quarterly recovery in Apple and Samsung shipments.

Commenting on overall market dynamics, Senior Analyst Harmeet Singh Walia said, “Most major vendors continued experiencing annual shipment declines in the third quarter of 2022. Russia’s escalating war in Ukraine, ongoing China-US political distrust and tensions, growing inflationary pressures across regions, a growing fear of recession, and weakening national currencies all caused a further dent in consumer sentiment, hitting already weakened demand. This is also adding to a slow but sustained lengthening of smartphone replacement cycles with smartphones becoming more durable and as technology advancement slows. This is accompanying, and to a smaller degree advancing, a fall in the shipments of mid- and lower-end smartphones, even as the premium segment weathers the economic storm better. Consequently, and thanks to an earlier launch of the latest iPhone series this year, Apple emerged as the only top-five smartphone vendor to manage annual shipment growth in the quarter.”

While Samsung grew QoQ in Q3 2022 thanks to record presales of its premium fold and flip smartphones, compared with the same quarter last year, however, its shipments fell by 8% YoY. This is primarily down to dampening consumer sentiment in several of its key markets. This also affected top Chinese brands, whose shipments remained low compared with last year as they were getting rid of excess inventory and at the same time managing a slowdown in the home market, China. However, they were able to capitalise on Apple and Samsung’s exit from the Russian market, in which their share increased substantially.

Associate Director Jan Stryjak noted, “With the full force of the latest iPhone launch being felt in Q4, we expect further quarterly improvement in the coming quarter, although central banks’ attempts to control inflation will further reduce consumer demand. The channel inventory is still higher, and the OEMs will focus on getting rid of excess inventory in Q4 as well. Hence, shipments are unlikely to reach last year’s levels, let alone pre-pandemic Q4 levels of over 400 million units. Looking further ahead into 2023, we expect sluggish demand with lengthening replacement rates, especially in the first half of the year.”

*OPPO includes OnePlus from Q3 2021

Feel free to reach us at press@counterpointresearch.com for questions regarding our latest research and insights.


You can also visit our Data Section (updated quarterly) to view the smartphone market share for WorldUSChina and India.

Related Posts

Background

Counterpoint Technology Market Research is a global research firm specializing in products in the TMT (technology, media and telecom) industry. It services major technology and financial firms with a mix of monthly reports, customized projects and detailed analyses of the mobile and technology markets. Its key analysts are seasoned experts in the high-tech industry.


Analyst Contacts:

 Harmeet Singh Walia

 Twitter Logo - PNG and Vector - Logo Download  

Jan Stryjak

 Twitter Logo - PNG and Vector - Logo Download  

Tarun Pathak

 Twitter Logo - PNG and Vector - Logo Download  


Follow Counterpoint Research
 Twitter Logo - PNG and Vector - Logo Download  

Apple adds to growing industry sustainability drive

Over the last few months, various OEMs have been busy touting their sustainability credentials. At the launch of its latest foldable smartphones in early August, Samsung emphasised its ‘Galaxy for the Planet’ initiative, a sustainability platform which establishes a set of targets to be reached by 2025 to reduce Samsung’s environmental footprint and lessen resource depletion from production to disposal of its Galaxy products. And in early September, HMD Global introduced ‘Circular’, a new sustainability subscription service that aims to give Nokia devices a second life through recycling, refurbishing and re-subscribing. Then, at its launch event last week, Apple went to great lengths to outline the eco-friendliness of its new devices.

Let’s take the iPhone 14 Pro as an example. Using Apple’s own words, the iPhone 14 Pro is “designed to minimise its impact on the environment, with 100% recycled rare earth elements used in all magnets, including those used in MagSafe, and 100% recycled tungsten in the Taptic Engine. The model also includes 100% recycled tin in the solder of multiple printed circuit boards, and 100% recycled gold in the plating of multiple printed circuit boards and in the wire of all cameras. Fiber-based packaging does not use outer plastic wrap, bringing Apple closer to its goal of completely removing plastic from all packaging by 2025”.

Sustainability highlights of the iPhone 14 Pro

Source: Apple

All the focus on recycled materials has resulted in a drop in carbon emissions throughout the new devices’ life cycles compared to last years’ iterations. For example, the iPhone 14 has a carbon footprint of 61kg of CO2e, down from 64kg for the iPhone 13, and the iPhone 14 Pro has a carbon footprint of 65kg of CO2e compared to 69kg for the iPhone 13 Pro. This reduction in carbon footprint is mostly down to the increased use of recycled materials and a more efficient supply chain, meaning that the production proportion of the phone’s life cycle has dropped by as much as 10%.

One concerning point, however, was the increase in carbon emissions through the use of the new devices. This is especially true with the iPhone 14 Pro, where carbon emissions through use have increased by 18% compared to the iPhone 13 Pro (9.8kg CO2e versus 8.3kg CO2e). This could be down to the iPhone 14 Pro’s use of the new A16 Bionic chip, although Apple claim the A16 is 15-20% more efficient than the A15. Perhaps then it is due to the slightly upgraded Pro Motion display?

Carbon footprints for current and previous iPhones

Source: Apple

Another interesting point is how much of the carbon footprint is accounted for by the manufacturing of the devices (around 80%). Yes, this is on the way down, but still accounts for the vast proportion of the phone’s life cycle. It is heartening, therefore, to see that iPhones are the most popular second-hand phones globally. Refurbished iPhones are a great way to ensure that the significant carbon emissions of producing a new iPhone go towards multiple lives of the device, not just one.

Refurbished smartphone sales, 2021

Source: Counterpoint Research

Apple also reiterated its carbon neutrality goals: by 2030, Apple plans to be 100% carbon neutral across its entire manufacturing supply chain and all product life cycles. This means that every Apple device sold, from component manufacturing, assembly, transport, customer use, charging, all the way through recycling and material recovery, will have net-zero climate impact. Setting ambitious goals such as this is vital in creating a sustainable future for the smartphone industry. With Apple’s resources and momentum, its target looks achievable.


Term of Use and Privacy Policy

Counterpoint Technology Market Research Limited

Registration

In order to access Counterpoint Technology Market Research Limited (Company or We hereafter) Web sites, you may be asked to complete a registration form. You are required to provide contact information which is used to enhance the user experience and determine whether you are a paid subscriber or not.
Personal Information When you register on we ask you for personal information. We use this information to provide you with the best advice and highest-quality service as well as with offers that we think are relevant to you. We may also contact you regarding a Web site problem or other customer service-related issues. We do not sell, share or rent personal information about you collected on Company Web sites.

How to unsubscribe and Termination

You may request to terminate your account or unsubscribe to any email subscriptions or mailing lists at any time. In accessing and using this Website, User agrees to comply with all applicable laws and agrees not to take any action that would compromise the security or viability of this Website. The Company may terminate User’s access to this Website at any time for any reason. The terms hereunder regarding Accuracy of Information and Third Party Rights shall survive termination.

Website Content and Copyright

This Website is the property of Counterpoint and is protected by international copyright law and conventions. We grant users the right to access and use the Website, so long as such use is for internal information purposes, and User does not alter, copy, disseminate, redistribute or republish any content or feature of this Website. User acknowledges that access to and use of this Website is subject to these TERMS OF USE and any expanded access or use must be approved in writing by the Company.
– Passwords are for user’s individual use
– Passwords may not be shared with others
– Users may not store documents in shared folders.
– Users may not redistribute documents to non-users unless otherwise stated in their contract terms.

Changes or Updates to the Website

The Company reserves the right to change, update or discontinue any aspect of this Website at any time without notice. Your continued use of the Website after any such change constitutes your agreement to these TERMS OF USE, as modified.
Accuracy of Information: While the information contained on this Website has been obtained from sources believed to be reliable, We disclaims all warranties as to the accuracy, completeness or adequacy of such information. User assumes sole responsibility for the use it makes of this Website to achieve his/her intended results.

Third Party Links: This Website may contain links to other third party websites, which are provided as additional resources for the convenience of Users. We do not endorse, sponsor or accept any responsibility for these third party websites, User agrees to direct any concerns relating to these third party websites to the relevant website administrator.

Cookies and Tracking

We may monitor how you use our Web sites. It is used solely for purposes of enabling us to provide you with a personalized Web site experience.
This data may also be used in the aggregate, to identify appropriate product offerings and subscription plans.
Cookies may be set in order to identify you and determine your access privileges. Cookies are simply identifiers. You have the ability to delete cookie files from your hard disk drive.